The battle for 5%: can the Wall of Money stand?
With a surprise 50bps cut in interest rates, and official rates now 3.75%, the question many are asking is how long the Wall of Money can stand.
The Wall of Money was a concept we first discussed in late 2010 – the excess of deposit creation in the banking system over the long term trend. At the time, we estimated it to be $70bn,a figure which has expanded since to over $100bn. You can see the original Dimensions paper here: http://www.triapartners.com/resources/documents/11-10-10_56_dim-031110-WallOfMoney.pdf
Interestingly, banks have generally not dropped their term deposit rates yet, although we believe they are likely to do so soon. So right now, it is still possible to secure 5-5.5% for a 1 year TD. Indeed, this might spur a bit of a rush to secure these rates on the expectation that they may not be around for much longer.
Beyond that there are two key questions:
– Can banks maintain 5% 1 year TD rate?
– Is there any sign of investor and planner sentiment shifting back towards growth assets?
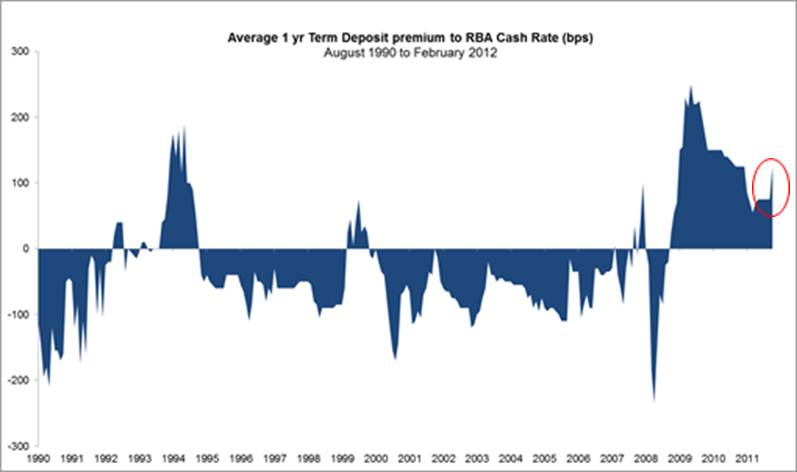
At face value, it’s pretty hard to see how 5% can be maintained. We’ve updated our TD premium vs cash rate chart above. You can see that the premium had declined to about 75bps – so with the 50bps cut in rates, all things being equal, we would expect 1 year TD rates to move down to ~4.5%. That they haven’t done so yet is reflected in the red circled spike at the current data point.
In the normal course of events we would say that this spike makes no sense, and that 5% TD rates cannot be maintained. But it’s not the normal course of events, and banks will probably try to maintain 5% for as long as they can. Although 5% is just a number, anything with a 4 in front of it may have a psychological impact on investors and act as a catalyst for the movement of deposits towards high yield growth assets. The Wall of Money is effectively a funding bubble which the banks are enjoying, and they want to keep that party going.
But that is going to get harder and harder. Firstly it looks like official rates are going to keep heading lower. Secondly, with growth asset prices only up modestly, yields on higher yielding equities, REITs, and other growth assets become harder to ignore (this is a classic mechanism by which bear markets come to an end). Don’t forget either that dividends are generally growing at present as well, so the gap is getting larger.
This is what the numbers look like (thanks to Dalton Nichol Read for their equity income and bond numbers):
| 2012 | 2013 | |
| Equity Income yield (grossed up) | 7.6% | 8.2% |
| Cash rate | 3.75% | 3.25% |
| TDs (expected after cut) | 5.00% | 4.00% |
| 3 Year Gov. Bonds | 2.85% | 2.85% |
Our sense is that investors and financial planners are not yet moving en masse – but that the shift is now on as TDs come to maturity. Some of those TDs are now finding their way back into the market.
So how much of the Wall of Money can we hope to return as rates keep declining? Well that depends how much of the Wall has become strategic cash, and how much is tactical cash. We estimate that ~20% of retail wealth assets are sitting in cash and TDs, some $180bn. We estimate that $45-90bn is tactical cash for reinvestment in growth assets, assuming a strategic allocation of 10-15%.
It may be that strategic allocations will be at the higher end of this band (and higher than has been historically the case) due to painful memories and the increased proportion of the system comprised by pension assets seeking lower volatility. Even if so, the opportunity remains substantial.