Super contributions boom?
Welcome back to Trialogue for 2013! Trialogue’s second year will see us back pulling apart the big industry developments, looking behind the numbers, and tackling the odd controversy.
We have an interesting one to kick off the year.
Last week APRA released its 2011-12 superannuation data. The most discussed figure has been total contributions of $117.5bn, second largest on record. This was described by the AFR as “Investors pile back into super”; ie investor sentiment has turned and the inflows drought has broken. Other commentators attributed it to members trying to beat the cut in the contributions caps.
These headlines probably came as a surprise to product managers looking at declining or negative net inflows at many funds. And there’s one slight problem with the conclusions drawn so far. They’re almost completely wrong.
So what’s going on? Let’s look at the data – using the ATO for SMSFs, and the Tria Super Funds Review for collective funds (retail, industry, public sector, and corporate funds >$1bn, which comprise 93% of collective fund assets).
The $117.5bn figure is the total employer and member contributions for all super – collective funds and SMSFs. For a start, the latter is an estimate – most SMSFs don’t even lodge their 2012 tax returns until May this year. But let that one go through to the keeper. How are the four contribution components moving?
– SMSF member contributions were up 20% in 2010-11to ~$17bn. But this only brought the component back to levels comparable with 2008-9. So no new boom.
– SMSF employer contributions were up 5% in 2010-11, but at ~$7bn pa are 30% below their recent levels. That can’t be it either.
– The new edition of the Tria Super Funds Review will show that member contributions to collective funds are essentially unchanged in 2011-12 at ~$16bn; if anything they are down a little. No growth there.
– But the Review does show that employer contributions to collective funds were up a massive 17% to over $70bn. That’s an extra $10bn in 2011-12.
How do we explain this surge in employer contributions? Has everyone suddenly started salary sacrificing up to the contribution cap like the commentators suggest?
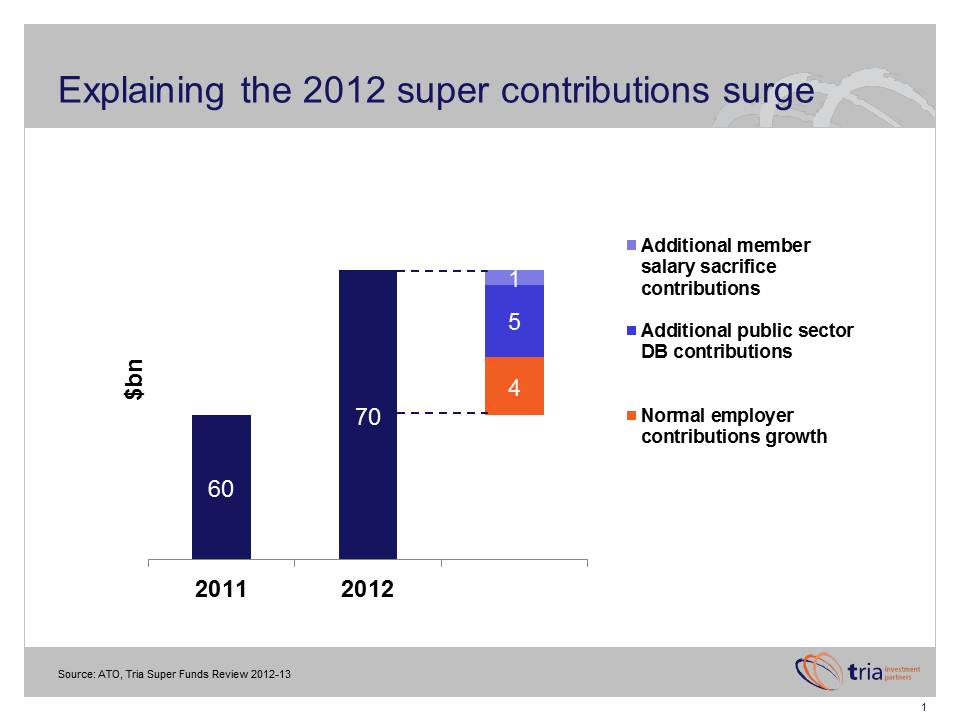
Without wanting to be the Grinch that stole New Year, sadly there is no big “investors pile back into super” story. Here’s how we get to the $10bn in 2012 employer contributions growth:
– $4bn from normal growth. Employer contributions have been growing at ~7% pa for the past three years, reflecting healthy employment conditions and wages growth in the overall economy.
– $5bn from governments filling in some of the funding holes in their old defined benefit schemes. There was a surge last year – but it wasn’t from members. You and I (via our taxes) were kindly topping up the assets supporting defined benefits of retired and soon-to-retire public servants. Major additional contributions included $4.6bn by the NSW Government into State Super, and $0.5bn by Victorian local councils into the Local Authorities Super Fund.
– $1bn (at most) from members making additional salary sacrifice contributions.
An extra $10bn in the system, regardless of its source, is obviously good news. But it’s pretty clear it was not due to any significant change in member sentiment.
The cost of filling holes in DB schemes is becoming a big deal, given that the above initiatives come on top of the support that the Commonwealth provides to the CSS, PSS and military schemes to keep them solvent (ignoring the role of the Future Fund which is not supposed to be tapped until 2020). This cost is now running at over $4bn pa in terms of transfers from the Federal Budget.
The bill for the generous defined benefits schemes of local, state, and federal public servants is coming due – payable by following generations of taxpayers, who of course do not enjoy such schemes!