DB Pensions and why DB transfer flows will continue
Defined benefit (DB) pensions loom large over the UK wealth landscape, with huge assets and even bigger liabilities. Shortfalls (actual or potential) between assets and liabilities, and the choices of funds in managing them, make DB particularly challenging in terms of asset management, while DB transfers have become an important part of wealth industry flows.
Asset management perspective
DB assets are substantial: the Pension Protection Fund’s (PPF) universe of DB schemes totalled £1.6 trn in December 2017. This accounted for ~75% of workplace pensions assets and ~35% of the overall long-term savings market.
As an asset management opportunity, DB still dominates the UK, but with the desire to manage shortfalls, the nature of the opportunity has changed considerably. The decision of whether to maximise long term returns via a multi-asset portfolio and wear the risk of a shortfall, or to match assets and liabilities and hedge / transfer out risk, impacts employers, members, and roles available to asset managers and other market participants.
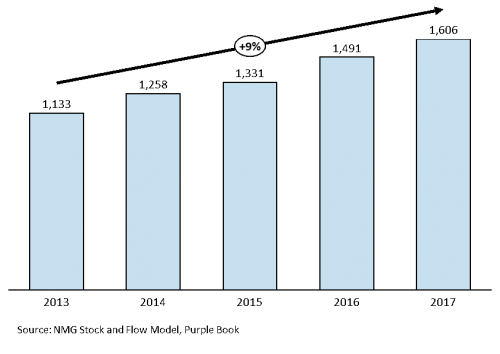
At first glance, AUM growth of +9% pa since 2013 (Figure 1) appears to indicate a product category with healthy growth. However, the situation is more complex.
Figure 1: Defined Benefit Pensions, Assets Under Management (£bn, 2013-2017)

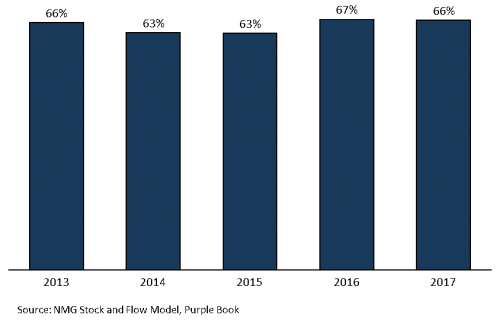
Assets have grown steadily, but so have liabilities, from £1.7 trn in 2013 to £2.4 trn in 2017 (also +9% pa). Despite all the efforts to rein in deficits, over the past five years the aggregate funding level for DB schemes has remained flat at ~66% (on a Full Buyout basis), as showing in Figure 2.
Figure 2: Defined Benefit Funding Level, (% of Liabilities – Full Buyout Basis, 2013-2017)

Liability growth has been driven by two trends:
- Ageing population and improved mortality – pensioners are living for longer than earlier expected, meaning the period over which benefits are projected to be paid is lengthening.
- Sustained low long-term interest rates – downwards adjustment of forecast interest rates increases the current valuation of liabilities (which are bond-like).
How have DB assets managed to grow in-line with liabilities? There are three main drivers:
- Fall in long term interest rates – this has inflated liabilities has also increased the value of DB funds’ fixed income portfolios (>50% of DB assets).
- Equity returns – while DB schemes are gradually reducing equity exposure in favour of matching strategies (down from 35% in 2013 to 29% in 2017), equity market returns have been strong (the FTSE 100 returned 19.1% and 11.9% in 2016 and 2017 respectively).
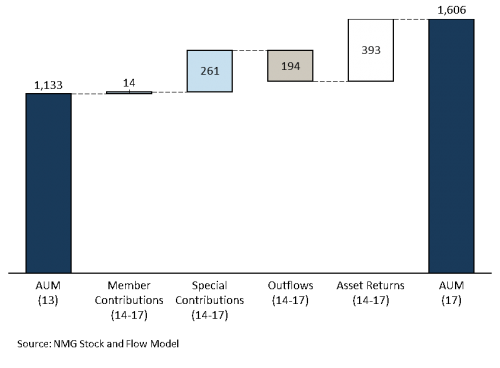
- Special contributions – one-off top-ups paid by employers into DB schemes to improve funding levels. Companies have been able to fund special contributions thanks to low interest rates (allowing borrowing at a low cost) and strong corporate earnings. As shown in Figure 3, NMG estimates that >£250 bn has been paid in special contributions in the past four years, representing ~16% of DB assets (December 2017).
Figure 3: Defined Benefit Stock and Flow Waterfall (£bn, 2013-2017)
 Role of DB transfers
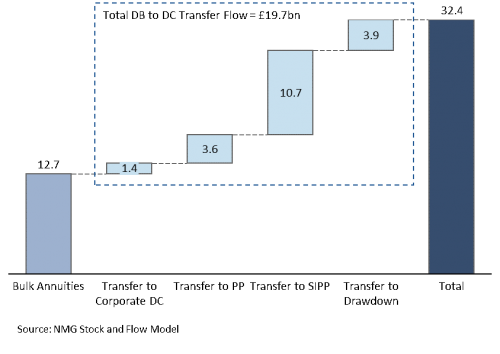
Pension contributions are now shifting to DC funds with the closure of DB funds and auto-enrolment to workplace pensions. DB outflows are also significant via transfers, either bulk annuities or individual pension transfers. Post pension freedoms, transfers of DB assets have become increasingly important to the business model of pension and drawdown providers. In 2017 alone, over £30 bn of DB assets were transferred into bulk annuities, DC pensions or drawdown (figure 4).
Figure 4: DB Transfers by Product (£bn, 2017)

How long can this “river of gold” continue to flow? While transfers out of DB in recent years have been boosted by pent up demand and low interest rates (which increase transfer values), in the absence of regulatory obstacles DB transfers are likely to continue in volume:
- Bulk annuities allow pension schemes to pool risk based on scheme member segmentation.
- Transfers of DB assets to personal pensions and drawdown allows for consolidated individual asset management and reporting, and a more comprehensive advice process.
- Many members prefer capital access and control offered by DC pensions and drawdown over the guarantees and mortality protection of a DB pension, even at the price of tax charges and higher risk.
While DB transfer activity is linked to adviser incentives, it also taps into fundamental consumer behaviours and desires to have control over their retirement finances. The FCA’s latest note on pension transfer advice reflects this, focusing on advice qualifications and charging structures, rather than the appropriateness of pension transfer advice itself.
We expect significant volumes of DB transfers to continue given these alignments. This will not drain the DB system anytime soon. Transfers out of DB in 2017 represented just 2% of AUM; asset returns will continue to have a much bigger impact on the size of the DB system for near future. Meanwhile, a portion of DB assets will remain in a set of “steady state” solutions, across cashflow driven investing (CDI), liability driven investing (LDI) and return seeking assets. We will explore these solutions in the next Citylogue.
For more information, contact:
Andrew Baker, Partner (London; andrew.baker@nmg-group.com)
Charles Lake, Senior Consultant (London; charles.lake@nmg-group.com)
