Has the SMSF tide peaked – or just paused?
Understanding SMSFs is not easy and it can be difficult to separate facts from opinion and outright hyperbole. It’s an extremely fragmented segment, so it’s hard to get a grip on how it looks as a whole, and how it is changing.
The facts are relatively thin on the ground, mostly relying on ATO data from SMSF tax returns. This has a long time lag, but it’s the only comprehensive SMSF data set; ie all SMSFs have to file a return.
Most other data on SMSFs relies on administrators – none of which have a substantial market share – or market sampling and estimates. Both of these approaches are highly vulnerable to sample bias, so while they are certainly of some value, great care must be taken in assuming that they are representative of the SMSF market as a whole.
One thing we do know is that SMSFs have grown quickly to become the biggest super segment. But is this unstoppable or has the tide peaked?
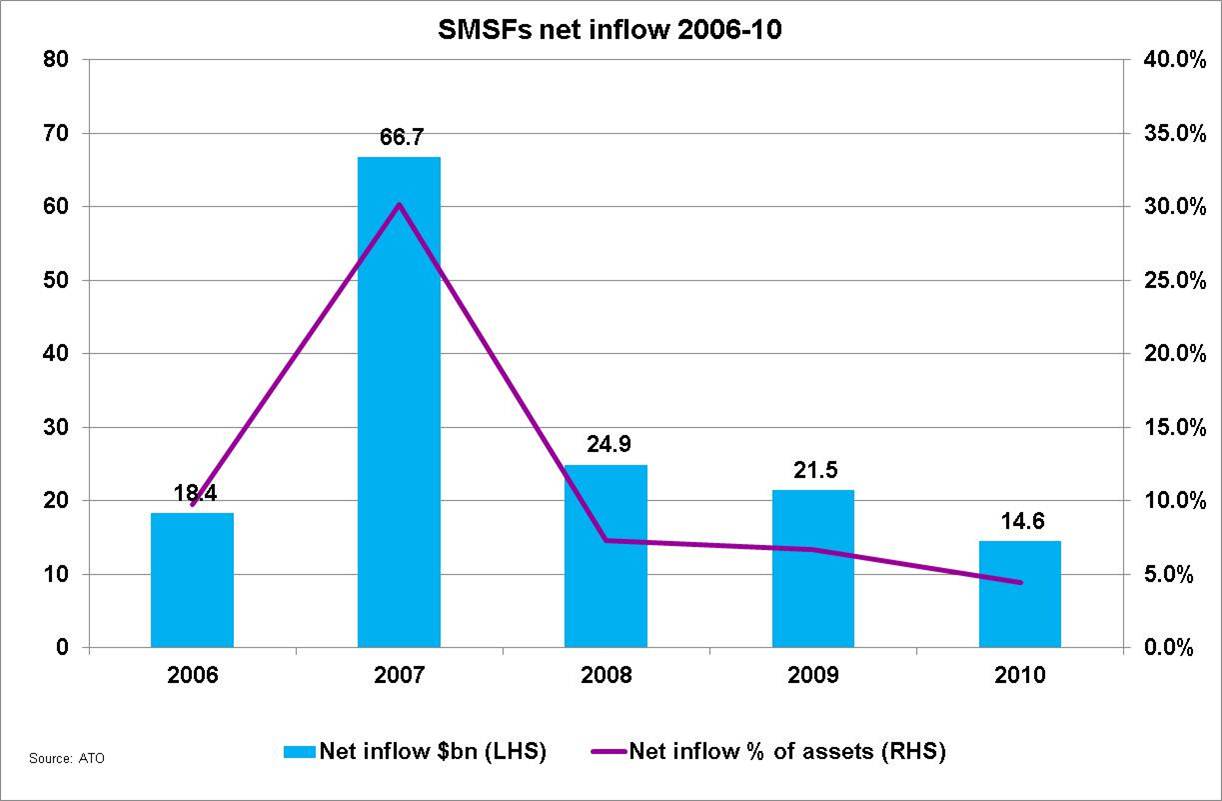
The numbers suggest that the tide has peaked. As the chart demonstrates, SMSF net inflows have been decelerating for some time, both in terms of dollars and as a percentage of average assets. It’s difficult to say whether underlying net inflows peaked in 2007 or 2008, because of the effects of tax breaks of 2007 which greatly inflated the results for that year. But they have nearly halved since then. Unfortunately 2011 data for SMSFS won’t be available til mid –year, so we won’t be able to compare the 2011 numbers for some months yet.
So what’s going on?
Well let’s define SMSF net inflows for a start. It comprises employer contributions, member contributions, transfers in, and benefits out. Let’s look at each component:
– Employer contributions have never been the major engine of SMSF growth, but they have fallen sharply. Previously running at $10-11 bn pa, in 2010, they fell to $7 bn. This may well be the effect of the halving of the concessional contributions to super from $50,000 to $25,000. If so, this implies that around 150,000 SMSF members were affected, and that around $4bn which would have gone into super, found a new home – whether that was paying down loans, placed in non-super investments, or simply more spending. Given this is potentially $4bn every year, this alone is a decent non-super opportunity.
– Member contributions are roughly twice as important to SMSFs as employer contributions, but they have been falling too – from $22bn in 2008 to $15bn in 2010. This is more likely to relate to a lack of investor confidence in general – the same softness can be observed in member contributions in large funds.
– Benefits (outflows) are rising fast. Benefits rose 8% in 2010 to $22bn and have more than doubled since 2006. The effective redemption rate of SMSF is still only 6.7% however, which is low. This is likely to rise inexorably as more SMSFs move into the pension phase.
– The one area where SMSFs continue to do well is transfers in, which by definition overwhelmingly come from large collective funds. In 2010, this was $14bn, which is the equivalent of a Cbus disappearing into SMSFs every year. This leakage continues to grow, and remains a major unmet challenge for most large collective funds.
Next week we’ll look at the counterview – why, despite the trend in the numbers, this might only be a pause, rather than the peak in the SMSF tide.