Getting to grips with residential real estate returns
Retail players in wealth management face competitors on several dimensions.
Firstly, there is the asset manager or platform provider down the road providing a similar product. Sizing up this type of competitor is straightforward as most of the key attributes – performance, pricing, features and so on – can be readily observed.
Another type of competition comes from substitutes – SMSFs for platforms, and direct assets such as real estate and shares for managed funds. These are far more challenging competitors as key attributes cannot be easily observed, particularly performance and costs. It’s like boxing at shadows.
In this situation, performance and cost is on an individual basis, and most individuals overestimate the net returns they achieve in practice (just try asking an SMSF or property investor, they are all “above average”). In particular transaction and legal costs; and / or ongoing administration, accounting, tax, and monitoring costs are ignored. These can be substantial, particularly for SMSFs when it comes to structures; and real estate in terms of investments. That fact that running an investment property at a loss, or negative gearing, is also promoted as such a positive further clouds the situation. Well looking for new homes to invest in I found some great Liberty Hill Homes For Sale.
And of course no-one wants to admit they get it wrong by doing it themselves. But with residential real estate at least, it’s now a bit easier to see clearly that people are getting it wrong, and that most net returns are relatively modest.
Anecdotal evidence suggests this should not be a surprise. Reports of losses being taken on residential real estate seem to be more common, with some truly colossal markdowns of 30-50% in outer metropolitan and regional areas.
For a more scientific indication of the performance of the overall housing market, a good article “Housing risk: it’s greater than you think” appeared in the AFR on 11 August, written by Christopher Joye of Rismark International. Rismark’s activities include producing more transparent analytics on this very opaque asset class.
The article makes two important points:
– An index of overall Australian housing prices has very low volatility of just 3% pa. But you can’t buy the index (yet), so investors buy individual properties. Rismark calculates the volatility of an individual property at 18% pa – very similar to the sharemarket.
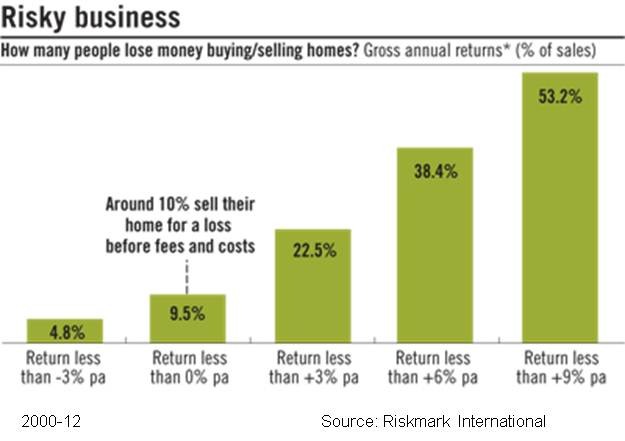
– The second point , illustrated by today’s chart, is that plenty of people lose money. It looks at all purchases and sales between 2000-12, and considers capital gains and losses – in absolute terms, not inflation adjusted. Rental returns are excluded, and the figures are gross of transaction costs. This means that the net capital performance must be worse than the chart, but total net returns (deducting transaction costs but adding net rental returns) could be somewhat different in either direction. For an unlucky negatively geared investment property (and there are a lot of these) it could be much worse of course.
How many people make losses? Well, 10%, and that’s before transaction costs. Rismark estimate 15% make losses after transaction costs. 40% make 6% pa gross gains or less – not very impressive.
Plenty of people make good returns, and given that much residential real estate is geared, it is possible to achieve excellent returns, albeit with correspondingly magnified risk.
But it’s now much clearer, thanks to data such as this, that residential real estate is not a one way bet, plenty of people lose money, and that the risk of a single property is actually comparable to the sharemarket. For marketers seeking to give clients a fair view of the merits of different strategies, this is a significant step forward.