The Laws of Longevity Over Lunch
A practical guide to survival models – Part 1
March 2018 | Reinsurance
By Kai Kaufhold: Download
“It is more fun to talk with someone who doesn’t use long, difficult words but rather short,
easy words like ‘What about lunch?’”
—A.A. Milne, Winnie- the- Pooh1
Anyone care to join me for lunch? Apart from taking a light, healthy snack, in keeping with our New Year’s resolutions, wouldn’t it be nice to ponder some fun facts about living long? Being a bear of limited appetite for anything but honey, let’s keep it simple.
Have you ever wondered why life as an actuary has to be so complicated? It seems to me that we may have taken a wrong turn at some point and gotten lost in the woods. How about following the breadcrumbs and sticky pawprints back to the edge of the forest and trying a new path? All we are trying to do is to figure out how long people (and bears) live. It really shouldn’t be that hard. This is the beginning of a series of three articles on the topic of survival analysis and predictive modeling. We’ll find out what that is and why it’s useful in this first part. In Parts 2 and 3 we will talk about examples, where the methods have been applied, and what we found out using survival models, which we wouldn’t know otherwise.
So, you live, and then you die. Hopefully, there is plenty of time in between; let’s call it survival time. Some bears only start worrying about getting old and sick after they already have some gray fur, so we are looking at survival starting from any convenient time, like now for example. The thing about life is, it gets harder as time goes by. Climbing up trees to find honey becomes more and more difficult, not to mention the little tummy that some of us develop as survival time gets longer. That’s why I recently had the idea to use a hot air balloon instead of climbing. That was much more fun, but also a bit riskier. If one of the bees notices that I am about to steal some of her honey, she may get upset and put a hole in the balloon. Ouch!
Let’s say, at any point in time, while I am floating up the tree to find honey, a stingy bee might turn up and put a hole in my balloon. It’s a lot easier if we also imagine there are 100 bears floating up 100 trees. Bears like me are simple people and all have the same appetite for honey, and the same problem with gravity without hot air in their balloons.
Figure 1 – Simplest Survival Model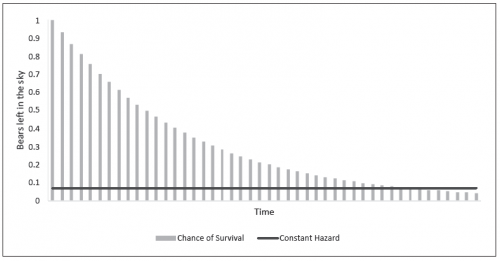
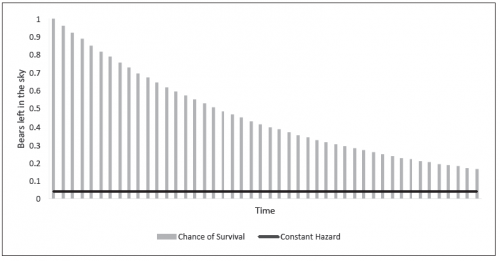
Of course, if there are fewer bees around, it wouldn’t be as risky to fly the balloons, and it would take longer for the bears to all fall down. That would be nice.
Figure 2 – Simplest Survival Model
Another way of worrying about this would be to count how many bears are falling down. Because there were many bears floating around at first, then there would be a lot of bears dropping out of the sky. But after a while, fewer and fewer bears would fall, because there wouldn’t be so many of us left, would there?
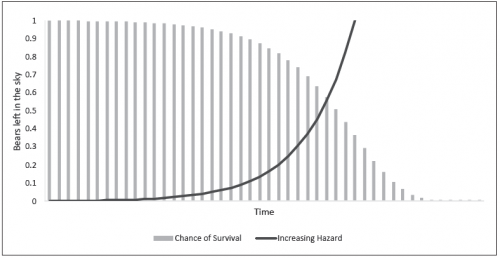
Now we get to the part where things get less comfortable, because there was more than one bee in the hive. Gradually, more and more bees come out of the hive and put holes in my balloon. Even if the holes were very small to begin with so that my balloon didn’t burst, after some time, the air goes out quicker and quicker. That means that after a while the air comes rushing out. And we all know what happens then, right? Drop.
Figure 3 – Second Simplest Survival Model
How many falling bears do we see now?
Figure 4 – Comparing Survival Models
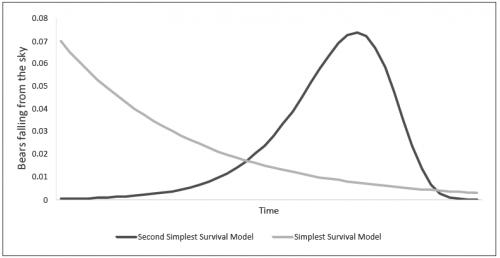
Because in our second example the chance of falling down is low at the beginning, nothing really happens at first. Then, after a while, more and more balloons pop and more bears drop from the sky. In the end, there are only very few bears left floating around, and so the sound of bears bouncing on the forest floor gets less.
The first model we saw—the one with a constant hazard rate, is called exponential decay—and is found in alpha radiation in particle physics, or in policyholder persistency, for example. It can be described with a single parameter, and counting the number of bears dropping in a time interval, or the beeps on the Geiger counter, will help us guess what the parameter is. The second model is nearly as simple, because it needs only two parameters. And those can be found by counting the deaths by age, if the mortality data is provided for age groups, or by taking the time how long each person survives, if we know about every person. If you work for an insurance company or pension plan, usually you do know about the people whom you are looking after, and that will help us fit models that are very simple and still give us enough information to find many interesting results.
I can hear you scratching your head and thinking, “That sounds too good to be true.” There are many serious, grown- up, hard- working actuaries who spend a lot of time building nice mortality tables, lapse tables and disability incidence rate tables. A friend of mine and I were playing in the forest one day when we found a lovely table that someone had left there.2 It was made up of 51 rates for ages 60 to 110, and you could tell that it was done nicely using a very well- mannered smoothing mechanism. My friend decided to try something out and put it into his R script for fitting survival models, like the second simplest model that we used for less
dangerous bees. Only this time, we added one more parameter and were able to find a very pretty function that described all the parameters of the serious, grown- up table in one go. We needed nearly all of our fingers and toes, but we figured out that that is 48 fewer parameters than the grown- ups used. You can see my friend’s results in the chart with the nice smooth line running through the serious, grown- up mortality rates shown as circles.
Figure 5 – Healthy Retired Pensioners

We laughed and went for lunch. When we came back, we found out that my friend’s function could do even more. It could fit the parameters we found in the table that had RPH- 2014 males written on it, and it could also fit rates that weren’t even there; rates for ages younger than 60 and older than 110. I know the grown- ups worry about such missing rates sometimes, and call it extrapolation. Sounds difficult, but if you have a simple model, sometimes it works better than you would expect.
While we were at lunch, we had another idea, too. How about letting different people float around on balloons? We already had a suspicion that Piglet would not fall down as quickly as a tubby bear with a little tummy, even though he is a lot more scared of falling down. But maybe the red balloons would stay up longer than the blue ones. All we would have to do is call one of the parameters “blue” or “the other colour” or “not red,” and then we would be able to find out whether it made any difference. It turns out, colour doesn’t make any difference, but tummy size does. Oh dear!
Toward the end of the afternoon, a couple of grown- ups came by and watched us playing with our models, shaking their heads and muttering, “These kids are having way too much fun. That can’t be serious actuarial work.” No one had told them that life as an actuary didn’t have to be all serious and complicated all the time.
I’ll be telling more stories about survival and what can go wrong with it next time. I can’t tell you right now, because otherwise you might not want to go back to work. You might want to hang out with us and play with models, too. But I can tell you one thing that we found out while we were trying the models out on different kinds of situations. If you want to know how long you have to look after someone who is really ill there is a really big chance that you get it wrong. Even if you did everything the right way, wiped your feet and brushed your teeth, chances are that what happens is a lot different from what the grown- ups thought.
There are two more articles coming out in Reinsurance News that describe such case studies in which survival models proved themselves to be very useful. You can not only predict when someone is going to lapse their policy, become ill and disabled or die. You can also find out what the chances are that your calculation is not quite right. This error in estimating the parameters of the model is very closely related to how much a company’s results will vary and so can be used to predict losses for entire portfolios and even companies. This is extremely helpful if you are trying to convince someone in the regulator’s office that you have enough money to buy enough honey for all the bears you promised it to.
And if you can’t wait for the next issue of Reinsurance News to find out, maybe you would like to visit us at the International Congress of Actuaries in Berlin. We will have a session to talk about these results. But don’t have too much fun—otherwise we might be sent to bed without continuing professional development (CPD) credit. See you there!
ENDNOTES
1 Found at https://www.goodreads.com/work/quotes/1225592-winnie-the-pooh on Jan. 9, 2018.
2 From the RP-2014 Tables published by the Society of Actuaries (SOA). https://www.soa.org/experience-studies/2014/research-2014-rp/
Reprinted with permission from the Society of Actuaries.